
A white paper on the CRE maturity wall for lenders and funds with commercial real estate loan exposure. By Andrew Shook, Mercury Capital Partners, in collaboration with CREModels.
Data as of September 23 to October 8, 2026. Figures marked (E) are the author’s estimates from the model described in Appendix A; statements marked (I) are the author’s inferences. All other figures cite a named source. Nothing in this paper is investment, legal or accounting advice.
Executive summary
Thesis
Market watchers tend to see the maturity wall as a problem of volume, hence the prevalence of imagery such as “the looming avalanche of maturities coming due.” But in fact, sorting is the real challenge in today’s environment. At the time of this writing, the benchmark 10-year Treasury yield had reached as high as 5.35%. At such rates, most loans written in 2021 and 2022 cannot refinance at par, yet only some of them are true losses. The line between a liquidity gap that is bridgeable by rescue capital and a solvency gap that requires a write-down runs asset by asset, and it moves with every 50 basis points of increased cap rate. Lenders who see that line clearly, from current property-level data, will make better decisions. Those who rely on stale appraisals and annual borrower financials will extend and foreclose on the wrong loans, incurring unnecessarily large losses.
This white paper presents a framework for classifying maturing CRE loans based on their underlying credit characteristics. By evaluating liquidity, solvency, cash flow, collateral value, extension economics, and capital treatment, lenders can better distinguish loans that warrant accommodation from those that require resolution.
Key observations
- CRE is priced for a rate environment that no longer exists. The all-property cap rate of about 6.85% sits roughly 174 bp over the 10-year, about two standard deviations below its 2009-2026 average of 411 bp. After capex, stabilized multifamily and industrial investments at today’s rates yield less than AAA corporate bonds.
- Rates reset twice in 2026. The 5-year Treasury rose about 146 bp after the February 28 strikes on Iran. The Fed then hiked in September, and the market now prices three more hikes, with 1-month Term Secured Overnight Financing Rate (SOFR) peaking at 4.70% in August 2027.
- Refinancing is the pressure point. About $875 billion matures in 2026. At today’s coupons, lender Debt Service Coverage Ratio (DSCR) tests cap new proceeds at 51-59% of current value in the five property types modeled. Agency leverage tiers of 65-80% are irrelevant for stabilized multifamily.
- Vintage matters more than sector, with one exception. 2021 loans on multifamily, industrial, storage and manufactured housing face refinance gaps of 22-39%, while 2016 loans largely clear. Office fails in both vintages because the collateral itself has lost value.
- Most gaps are cash flow rather than collateral problems. Outside office, 2021 loans typically sit at 65-89% current Loan to Value (LTV) and remain well secured. That keeps them on accrual and eligible for extension under the 2023 interagency workout guidance.
- Floating-rate extensions no longer pencil. A typical 2021 bridge loan covers only 0.75x to 0.86x of interest at the forward SOFR peak. A rate cap struck to protect DSCR costs more than 4.6% of a 75% LTV loan for three years.
- Extensions are running out, and loss recognition is the real limit. Extensions fell from 41% of expected maturities in 2024-25 to 21% in 2025-26. Once a loan stops being well secured, it moves to nonaccrual and a write-down that consumes capital dollar for dollar.
- Underwriting cushion now decides outcomes. A book written at 65% LTV faces a liquidity problem. A book written at 75% LTV crosses into insolvency at +50 bp of cap rate expansion, with half the loans underwater. On that book, the sponsor’s remaining equity is worth about half the cash needed to save it.
- The decisive variable is information. Every decision above depends on current NOI, current expenses, current value and the sponsor’s true capacity. Insurance, labor and repair costs are rising faster than rents, so trailing financials overstate NOI, and appraisals lag the market.
What lenders and funds should do
Treat asset management and reporting as risk controls rather than administrative tasks. Require current rent rolls, trailing-12-month operating statements with expense detail and insurance renewals every quarter. Re-underwrite every loan maturing in the next 24 months at today’s rates and forward curve. Recalculate property values at +50 and +100 bp cap rates on actual NOI. Classify each loan as a liquidity case or a solvency case, and match the response to the case. Portfolio details will vary. The need for accurate, current data to make these calls does not.
1 / CRE Is Priced for a Different Rate Regime
Cap rates have barely moved while the risk-free rate has moved a great deal. CBRE’s H1 2026 Cap Rate Survey reports an all-property average that was essentially flat against H2 2025, even as the 10-year Treasury rose. The survey was fielded in late June, when the 10-year sat near 4.6%. As of October 2026, it was trading in a range of 5.32% to 5.35%. Survey marks therefore understate how thin today’s spread has become.
| Measure | Mean | Std. dev. | Today | z-score |
|---|---|---|---|---|
| Cap rate minus 10Y Treasury | 411 bp | 106 bp | ~174 bp | -2.2 |
| Cap rate minus BBB corporate yield | 218 bp | 89 bp | ~84 bp | -1.5 |
Corporate credit is also tight, but CRE is tighter relative to its own history. BBB option-adjusted spreads sit at 61% of their 2015-2025 average and high yield at 67%. The CRE spread sits at roughly 42% of its average.
Sector pricing against the credit curve
A cap rate is an unlevered, pre-capex, growth-bearing equity yield. A bond yield is a senior, contractual claim. Deducting recurring capex shows what a buyer actually earns in cash before growth.
| Sector | Cap rate | Spread to UST | Prices like | After capex | Prices like |
|---|---|---|---|---|---|
| Office Suburban A | 8.82% | 371 bp | Wide of B | 96 bp | BBB |
| Office CBD A | 8.24% | 313 bp | B | 38 bp | AAA |
| Hotel Full-Service City | 7.29% | 218 bp | BB/B | -32 bp | Inside UST |
| All-property | 6.85% | 174 bp | BB | 24 bp | Inside AAA |
| Retail Neighborhood A | 6.31% | 120 bp | BBB/BB | -55 bp | Inside UST |
| Industrial A | 5.62% | 51 bp | AA/A | -49 bp | Inside UST |
| Multifamily Infill A | 5.13% | 2 bp | Inside AAA | -123 bp | Inside UST |
Multifamily and industrial are growth trades priced as if they were yield trades. To match a BBB bond plus a modest illiquidity premium, multifamily needs roughly 3.1-3.6% annual NOI growth (E). Office and hotel spreads look wide because the market is pricing default-like NOI erosion. Retail is the one stabilized sector priced fairly for its risk.
2 / The Rate Regime Changed Twice in 2026
The year delivered two distinct shocks. The first was a term-premium shock. The 5-year Treasury bottomed near 3.51% on February 28, the day the United States and Israel struck Iran, and has since risen to 4.97%. The second was a policy shock. Overnight SOFR sat in a narrow 3.50-3.73% range for most of the year, then jumped to 3.87% after the Fed’s September hike.
| Rate (9/23/26) | Current | 1-month change | 1 year ago |
|---|---|---|---|
| 1-month Term SOFR | 3.90% | +23 bp | 4.16% |
| 3-year SOFR swap | 4.64% | +62 bp | 3.23% |
| 5-year Treasury | 4.97% | +55 bp | 3.67% |
| 10-year SOFR swap | 4.60% | +35 bp | 3.54% |
| 10-year Treasury | 5.10% | +37 bp | 4.11% |
The market still expects more tightening, though not immediately. CME FedWatch now implies only about a 17% probability of an October rate hike, while markets continue to assign a much higher probability to additional tightening later in the year. The Chatham forward curve shows 1-month Term SOFR peaking at 4.70% in August 2027, and long-term borrowing costs remain near cycle highs. Strong economic growth, persistent inflation pressures and elevated long-end Treasury yields continue to support a higher-for-longer rate outlook.
Two features of the curve matter for CRE borrowers. First, the front end moved most: the 3-year swap rose 62 basis points in a month versus 35 basis points for the 10-year swap. Floating-rate borrowers absorb policy repricing more directly than borrowers with long-term fixed-rate debt. Second, swap spreads remain deeply negative, with the 10-year swap roughly 50 basis points below the 10-year Treasury. Swap-priced and floating-rate debt is therefore cheaper than Treasury-priced fixed-rate debt, encouraging borrowers toward floating-rate structures and greater rate-cap exposure at a time when rate volatility remains elevated.
3 / The Maturity Wall
The Mortgage Bankers Association reports that $875 billion of commercial and multifamily mortgages, 17% of the $5 trillion outstanding, is scheduled to mature in 2026, down from $957 billion in 2025. Multifamily alone accounts for $297 billion, with roughly $220-240 billion maturing in each of the following three years.
| Lender group | 2026 maturities | Share of book maturing |
|---|---|---|
| Banks and thrifts | $396B | 21% |
| CMBS, CLO and ABS | $200B | 25% |
| Debt funds and other lenders | $163B | 29% |
| Life insurers | $76B | 10% |
| GSEs and FHA | $39B | 4% |
Debt funds, CMBS and CLOs have the highest share of their books maturing, and that is where the 2021-22 floating-rate bridge cohort sits. Credit performance is already deteriorating: Trepp reports a July 2026 CMBS delinquency rate of 7.86%, with office at 11.91%, multifamily at 7.69%, retail at 6.96%, lodging at 5.35% and industrial at 1.13%.
Fundamentals: rents flat, expenses reset higher
| Sector | Revenue signal | Source |
|---|---|---|
| Multifamily | Rents +0.4% YoY; occupancy 94.2%, down 50 bp; 1.2M units in lease-up | Yardi Matrix, Aug 2026 |
| Office | Vacancy 18.3%; asking rents +2.6% YoY | CBRE, Q2 2026 |
| Retail | Rents +2.4% YoY | CBRE, Q2 2026 |
| Industrial | Vacancy 6.9%; asking rents +2.9% YoY | Cushman & Wakefield, Q2 2026 |
| Self-storage | Street rates -2.2% YoY; 71% of top 150 cities declining | Yardi / RentCafe, Aug 2026 |
| Manufactured housing | Lot rents +6.8% YoY, all regions positive; occupancy 95%. Listed REIT lot rent growth ~5-6.6%. Home shipments ~100,500 annualized, down 5.2% | Northmarq, Q1 2026; Capright, Sep 2026; MHI, Mar 2026 |
Operating expenses have reset permanently higher. A Federal Reserve study found multifamily insurance costs rose 75% per unit in real terms from 2019 to 2024. NAA data show repairs and maintenance up 28% from 2021 to 2024, payroll up 3.6% in 2024 and property taxes up 9.7% in 2023. Large apartment REITs guided 2026 same-store NOI between -0.75% and +0.3%, citing expenses growing faster than revenue. Trailing-12 statements capture last year’s premium and last year’s payroll, so they overstate forward NOI (I).
4 / The Refinance Math
For a stabilized asset, the maximum loan is the cap rate divided by the product of the required DSCR and the loan constant, expressed as a share of today’s value. At today’s coupons, the DSCR test binds long before the LTV test in every sector except office.
| Sector | Cap rate | Loan Rate | DSCR | Required debt yield | Max LTV |
|---|---|---|---|---|---|
| Multifamily (agency) | 5.15% | 6.4% | 1.25x | 9.4% | 55% |
| Industrial | 5.62% | 7.0% | 1.35x | 10.8% | 52% |
| Retail | 6.31% | 7.0% | 1.35x | 10.8% | 59% |
| Self-storage | 5.75% (E) | 7.0% | 1.35x | 10.8% | 53% |
| Manufactured housing | 5.25% (E) | 6.5% | 1.35x | 10.2% | 51% |
| Office CBD A | 8.24% | 7.9% | 1.35x | 11.8% | 60% (LTV cap binds) |
Agency grids advertise 65-80% LTV tiers, but no conventional Fannie Mae or Freddie Mac tier goes below 1.25x DSCR. At a 5.15% cap rate, DSCR caps proceeds at 52-55% of value. FHA, at 1.15x and 35-year amortization, is the only agency path above 60% LTV, at the cost of time and mortgage insurance.
Vintage is the dividing line
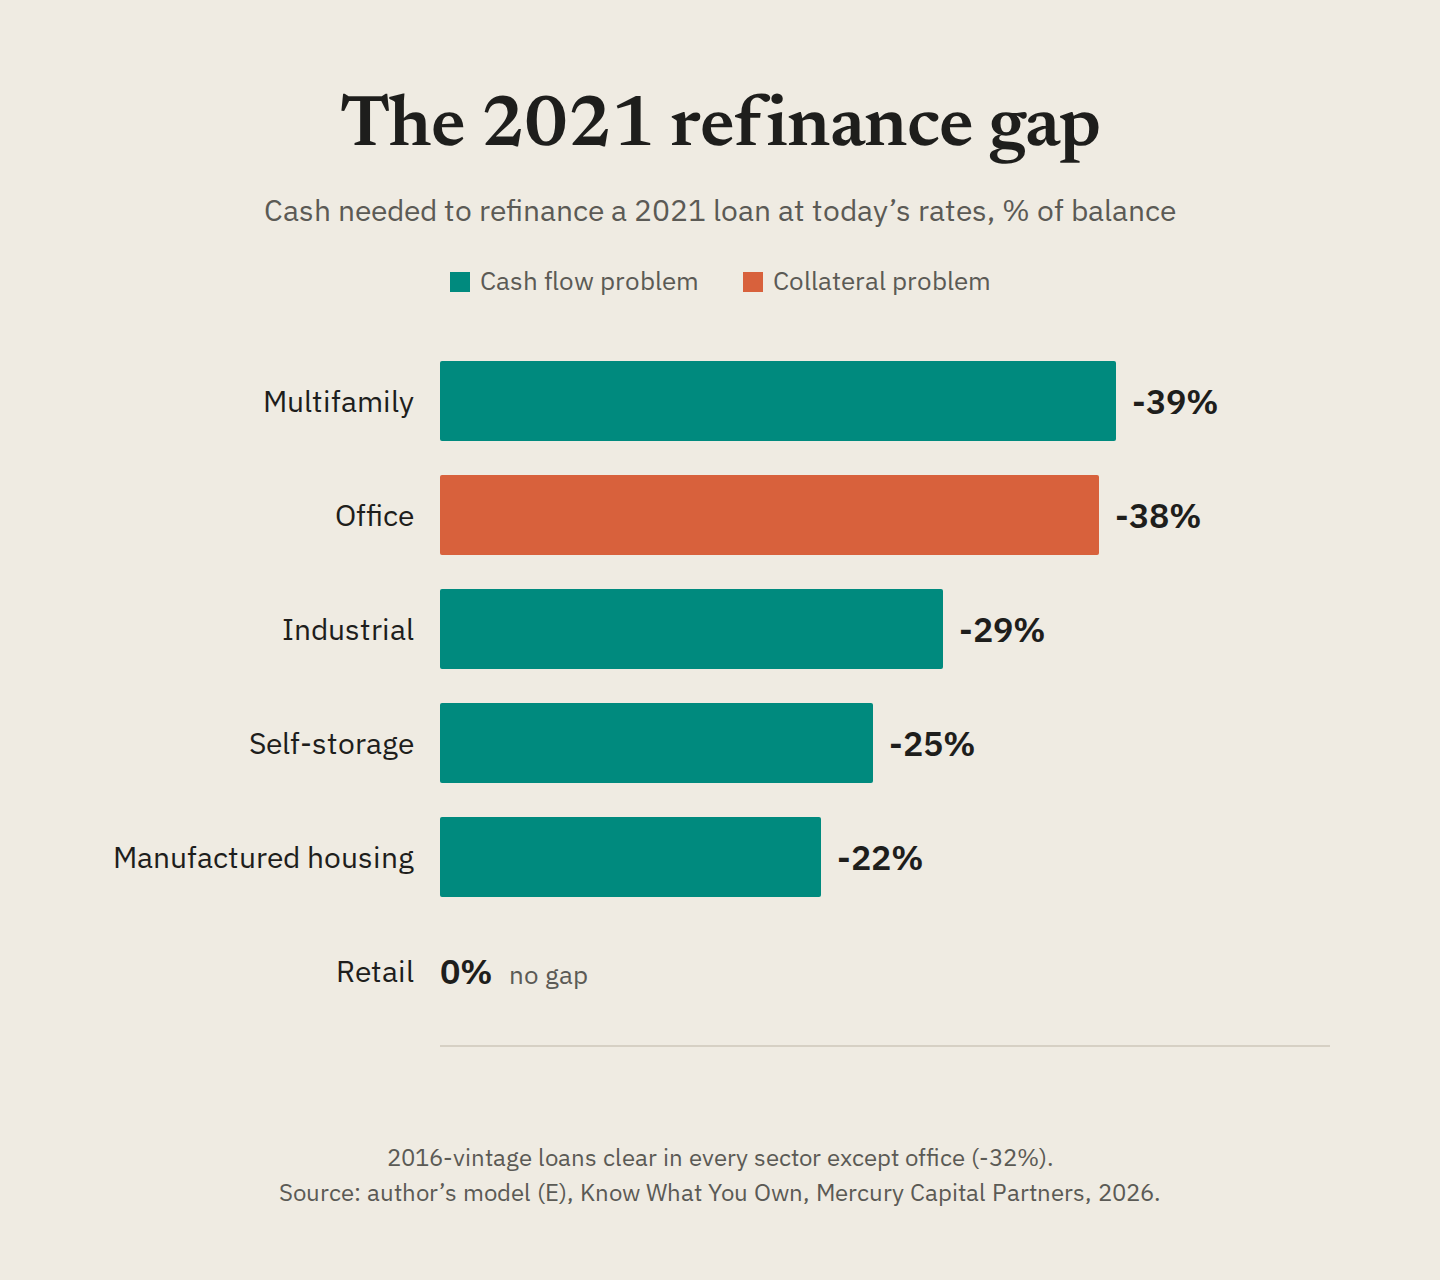
| Sector | 2021 vintage: proceeds / balance | Refi gap | NOI growth since origination required | 2016 vintage |
|---|---|---|---|---|
| Multifamily | 0.46 / 0.75 | -39% | +75% | Clears |
| Office | 0.40 / 0.65 | -38% | n/a (LTV binds) | -32% |
| Industrial | 0.46 / 0.65 | -29% | +75% | Clears |
| Self-storage | 0.49 / 0.65 | -25% | +48% | Clears |
| Manufactured housing | 0.55 / 0.70 | -22% | +59% | Clears |
| Retail | 0.65 / 0.65 | 0% | +8% | Clears |
Loans written in 2021 at 4-4.75% cap rates cannot clear at today’s coupons even where NOI grew. Loans written in 2016 benefit from a decade of amortization and NOI growth. Office is the exception: even 10-year paper fails, because value, not debt service, is the binding constraint.
Cash flow problem or collateral problem
| Sector | Value vs. 2021 | Current LTV | LTV after sale costs | DSCR on existing balance today |
|---|---|---|---|---|
| Multifamily | 0.84 | 89% | 96% | 0.79x |
| Office | 0.67 | 97% | 104% | 0.97x |
| Industrial | 0.89 | 73% | 79% | 0.96x |
| Self-storage | 0.91 | 72% | 77% | 1.01x |
| Manufactured housing | 1.07 | 65% | 70% | 1.06x |
| Retail | 1.11 | 58% | 63% | 1.35x |
In corporate finance terms, the table distinguishes between a fundamentally sound company burdened by an overleveraged balance sheet and a company whose underlying business can no longer support its obligations. The first case is primarily a liquidity problem. The second is a solvency problem.
On average, industrial, self-storage and manufactured housing loans appear more likely to fall into the first category. Values remain within roughly 11% of 2021 levels or higher, LTV after sale costs ranges from 70% to 79%, and DSCR hovers around 1.0x. Many of these properties continue to generate sufficient cash flow to support long-term value, but the original debt was often sized for a lower-rate environment. In those cases, time, amortization, sponsor equity, rescue capital or modest NOI growth may be enough to bridge the refinancing gap.
Office appears closer to the second category. Sector averages suggest values have declined by roughly one-third, leaving many loans with balances that exceed collateral value after sale costs. While individual assets vary widely, a meaningful portion of the sector faces challenges that cannot be resolved simply through an extension or a more favorable interest-rate environment.
Multifamily could be said to fall between the two. Average values are down about 16%, LTV after sale costs approaches 96%, and DSCR is approximately 0.79x. The sector does not face the same degree of impairment as office, but the margin for error is thin. Additional cap-rate expansion or further pressure on operating performance could push some loans from a liquidity challenge into a solvency challenge.
Retail appears better positioned than the other major property types on both leverage and debt-service metrics. Average LTV after sale costs is approximately 63% and average DSCR is 1.35x, suggesting the sector generally retains meaningful refinance capacity despite higher interest rates.
Sector averages only indicate where a loan is likely to be. Determining the position of any specific credit requires asset-level underwriting. A lender representative should tour the property, evaluate the surrounding market and develop a realistic view of condition, capital needs, operating expenses and market-clearing rents. The conclusions may not always be encouraging. Even so, it is far easier to address problems identified a year before maturity than in the final weeks before a loan comes due.
5 / Floating-Rate Extensions and the Rate Cap Problem
Most 2021-22 bridge loans float over SOFR and require an interest rate cap at each extension. The September repricing turned that requirement into a wall of its own.
| Strike | 1-year cap | 2-year cap | 3-year cap |
|---|---|---|---|
| 3.00% | 1.44% | 3.10% | 4.64% |
| 3.50% | 0.97% | 2.21% | 3.40% |
| 4.00% | 0.52% | 1.39% | 2.27% |
| 4.50% | 0.28% | 0.83% | 1.48% |
| 5.00% | 0.16% | 0.51% | 1.00% |
| 2021 multifamily bridge loan | 65% LTV | 75% LTV |
|---|---|---|
| Interest-only DSCR today (SOFR 3.90%) | 0.96x | 0.83x |
| Interest-only DSCR at forward peak (4.70%) | 0.86x | 0.75x |
| SOFR strike needed for 1.00x | ~3.65% | ~2.76% |
| 3-year cap cost at that strike | ~3.0-3.4% of loan | more than 4.6% of loan |
| Negative carry per year, % of value (today / peak) | 0.17% / 0.69% | 0.86% / 1.46% |
A cap strong enough to protect DSCR on a 75% loan costs more than five years of today’s cash shortfall. A lender that requires a real hedge is effectively requiring a paydown. A lender that accepts a 4.5-5.0% strike is carrying unhedged rate risk and should report it that way. Negative carry roughly doubles by the 2027 forward peak, when this year’s one-year extensions come due again. That is the next resolution wave (I).
6 / Regulation and Accounting: What Forces Action
Banks
Under the U.S. standardized approach (12 CFR 217.32), a performing CRE loan carries a 100% risk weight and a high-volatility CRE loan carries 150%. A loan 90 days or more past due, or on nonaccrual, carries 150% on the portion not guaranteed or secured by eligible financial collateral. Real estate is not eligible financial collateral, so a mortgage loan moves to 150% on its full balance. No higher weight applies in foreclosure. OREO has no specific weight and defaults to 100% as another asset.
Minimum total capital is 8% of risk-weighted assets under 12 CFR 217.10, with a 2.5% conservation buffer under 217.11 that restricts distributions when breached. This paper uses 10.5% as the operating floor.
Under the FFIEC Call Report instructions, a loan goes on nonaccrual when it is maintained on a cash basis because of the borrower’s deteriorating condition, when full payment of principal or interest is not expected, or when principal or interest is 90 days or more in default unless the loan is both well secured and in process of collection. The 2023 Interagency Policy Statement on Prudent CRE Loan Accommodations and Workouts allows a restructured loan to remain on accrual under prudent modified terms, requires about six months of sustained performance to return a loan to accrual, and states that modified loans to borrowers able to repay will not be adversely classified solely because collateral value has declined.
Life insurers
NAIC Life RBC assigns commercial mortgages in good standing to categories CM1 through CM5, with pre-tax factors of 0.90%, 1.75%, 3.00%, 5.00% and 7.50%, based on contemporaneous DSCR and LTV. A loan 90 days overdue moves to CM6 at 11%, and a loan in foreclosure to CM7 at 13%. Real estate, including foreclosed property, carries 11% following the NAIC’s 2021 recalibration to NCREIF experience. Under SSAP No. 37, a loan is impaired when the insurer probably cannot collect all amounts due, and is written down to collateral fair value less costs to sell once foreclosure is probable.
CMBS holders
Insurers’ non-agency CMBS designations come from NAIC financial modeling of expected loss, not agency ratings. Banks risk-weight CMBS tranches under the Simplified Supervisory Formula Approach, where the share of the pool 90+ days delinquent, in foreclosure or REO raises risk weights non-linearly, up to 1,250% on thin subordinate tranches.
Capital consumed by stage
| 2021 multifamily bridge loan | 65% LTV | 75% LTV |
|---|---|---|
| Current | $10.50 | $1.75 (CM2) |
| 90+ days, before write-down | $15.75 | $11.00 (CM6) |
| Foreclosure, written down to $85 | $28.39 | $26.05 (CM7) |
| REO at $85 | $23.93 | $24.35 |
Risk weights cover unexpected loss only. The expected loss hits capital dollar for dollar through allowances and write-downs. That is why lenders extend well-secured loans: extension defers a write-down, not a risk weight. It also explains why office, where collateral no longer covers the debt, is where lenders act first.
7 / Extensions: No Limit in Law, Real Limits in Practice
No regulation caps the number of extensions. Banks are governed by the 2023 workout guidance. Life insurers reset a restructured loan’s RBC category on new DSCR and LTV. CMBS servicers may modify a loan under IRS Rev. Proc. 2009-45 when they reasonably believe there is a significant risk of default, with no requirement that default be imminent, provided the loan remains principally secured by real property.
The practical limits bind first:
- Loss recognition. Once a loan stops being well secured, extension defers nothing.
- The lender’s own funding. Fund life, warehouse and repo maturities and CLO reinvestment periods cap how long a lender can wait.
- Borrower carry. Negative carry and cap costs erode sponsor capacity and deferred capex erodes the asset.
- Market behavior. Extensions fell from $384 billion, 41% of expected maturities, in 2024-25 to $200 billion, 21%, in 2025-26 (First American, citing MBA).
In practice, one or two extensions of 12 to 36 months in total is the realistic ceiling absent a meaningful paydown (I).
8 / Portfolio Stress: 65% vs. 75% Underwritten LTV
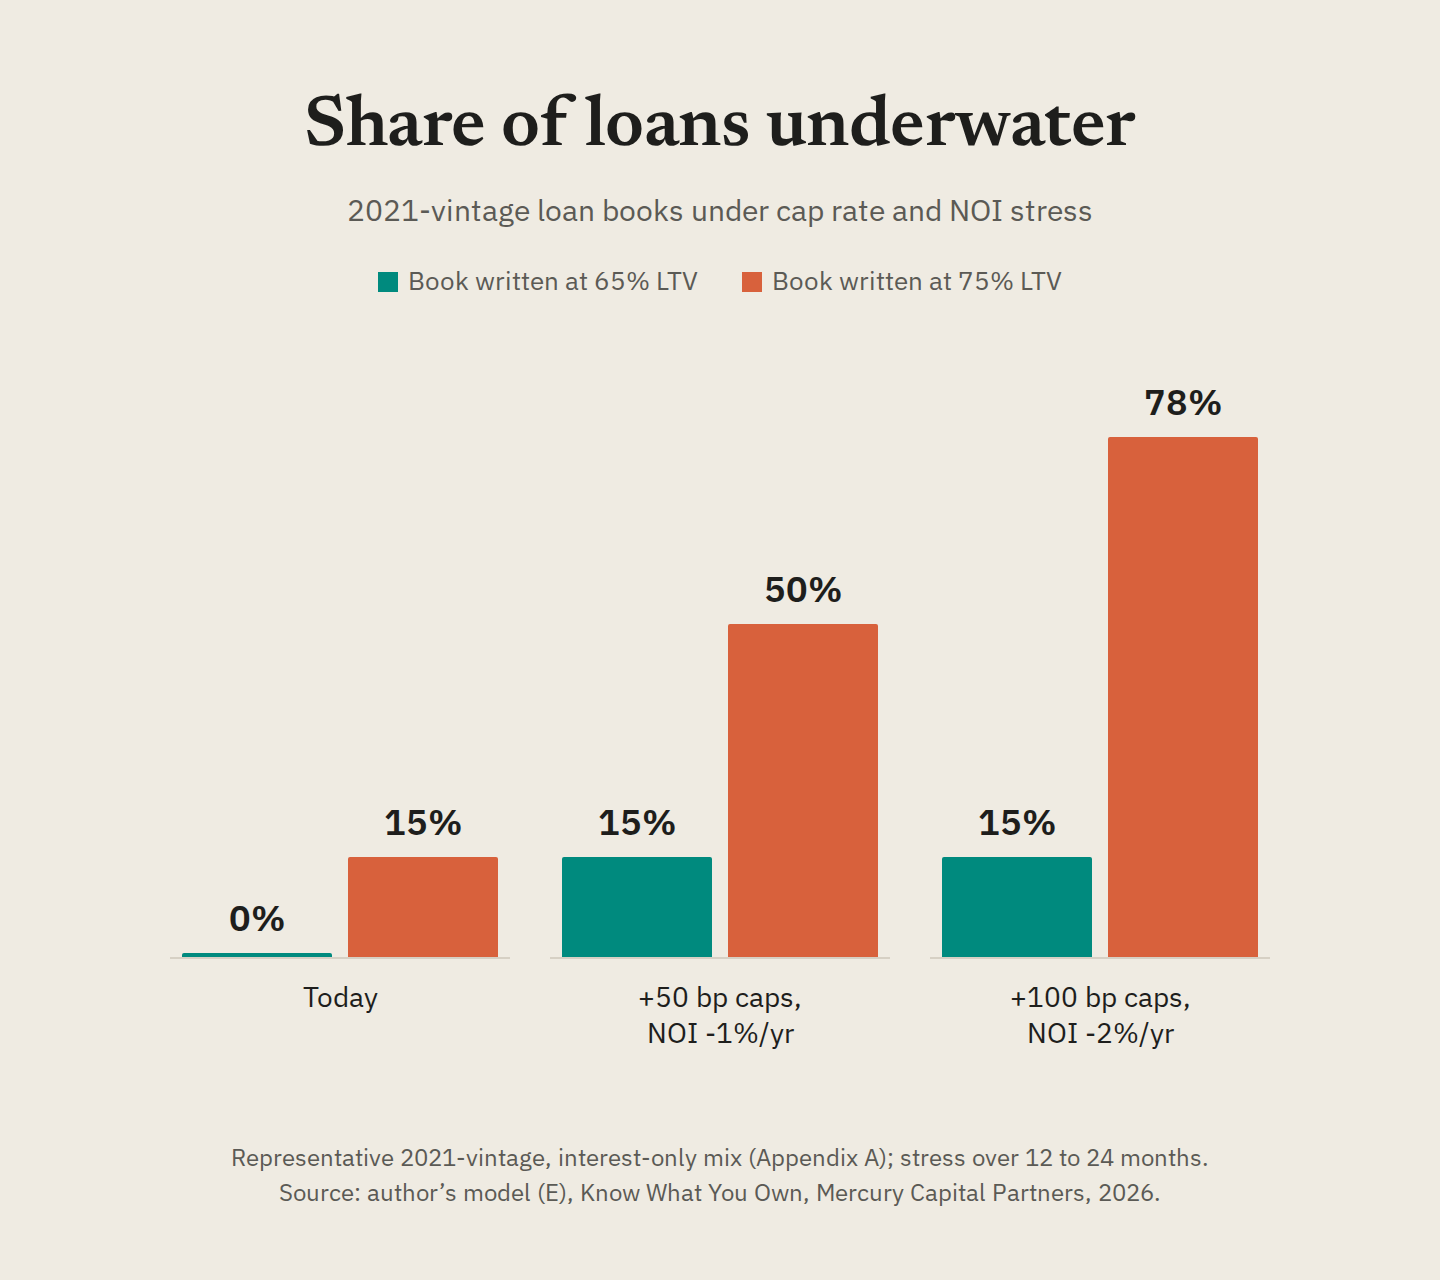
| Book | Scenario | Portfolio LTV | Cash-in to refinance | Share underwater | Loss given default |
|---|---|---|---|---|---|
| 65% | Today | 73% | 25% | 0% | 1.4% |
| 65% | +50 bp caps, NOI -1%/yr | 81% | 27% | 15% | 2.4% |
| 65% | +100 bp caps, NOI -2%/yr | 90% | 29% | 15% | 6.8% |
| 75% | Today | 85% | 35% | 15% | 3.8% |
| 75% | +50 bp caps, NOI -1%/yr | 94% | 36% | 50% | 9.8% |
| 75% | +100 bp caps, NOI -2%/yr | 103% | 39% | 78% | 16.1% |
The model applies a representative mix of 35% multifamily, 20% industrial, 15% retail, 15% office and 7.5% each of self-storage and manufactured housing to 2021-vintage, interest-only loans. Stress scenarios run over 12 to 24 months.
The 65% book has a liquidity problem: collateral holds almost everywhere except office, and a 25-29% paydown is the obstacle. The 75% book crosses into a solvency problem at +50 bp, with half the loans underwater. The 10 points of underwriting cushion absorb about 50-75 bp of cap rate expansion. Given the forward curve, +50 bp now looks like a central case rather than a stress case (I).
Who still owns the equity
| Book | Scenario | Equity left, % of original | Keep-or-walk ratio |
|---|---|---|---|
| 65% | Today | 68% | 1.48: recapitalize |
| 65% | +50 bp | 43% | 0.87: coin flip |
| 65% | +100 bp | 22% | 0.40: walk |
| 75% | Today | 55% | 0.53: walk |
| 75% | +50 bp | 20% | 0.18 |
| 75% | +100 bp | -10% | negative |
On a 75% book, the sponsor would need to invest about $0.25 per dollar of original value to protect about $0.14 of remaining equity. The equity exists on paper but is gone economically. The reality is more nuanced than a clean wipeout: extensions keep an out-of-the-money option alive, foreclosure costs give sponsors hold-up value, tax recapture and cancellation-of-debt income push sponsors to extend, and losses hit the capital stack from the bottom up, with GP promotes gone first and preferred equity the contested layer. Lenders who understand where each sponsor sits can use those incentives to negotiate paydowns rather than defaults (I).
9 / The Information Imperative
Every decision in this paper turns on a handful of property-level facts: current NOI, current expenses, current value, current rate exposure and the sponsor’s real capacity to fund. Those facts decide whether a loan is well secured, whether it is a liquidity case or a solvency case, whether an extension defers a loss or avoids one, and whether rescue capital earns its return. Portfolio-level averages cannot answer those questions. Only asset-level data can.
The standard information set is failing in three predictable ways (I):
- Trailing financials overstate NOI. Insurance renewals, payroll and repairs are resetting faster than rents, so last year’s operating statement describes a better property than the one the lender holds today.
- Appraisals lag. Appraisal-based indices trail transaction markets by two to four quarters, and survey marks taken in June predate a 50 bp move in the 10-year.
- Market inputs go stale in weeks. In September 2026 alone, the forward SOFR peak moved 60 bp and published agency floating-rate grids still reflected the prior month’s SOFR. A model built on August inputs understates peak carry materially.
An operating agenda for lenders and funds
- Refresh the data. Require quarterly rent rolls, trailing-12 statements with line-item expenses, insurance renewals and tax assessments on every loan maturing within 24 months.
- Re-underwrite at today’s inputs. Size every maturing loan at current coupons, the current forward curve and +50 and +100 bp cap rates.
- Sort the book. Classify each loan as a liquidity case or a solvency case, and flag loans that are not well secured before examiners or auditors do.
- Match the tool to the case. Liquidity cases warrant extension with paydown, rescue capital or pref equity. Solvency cases warrant discounted payoffs, note sales, deeds-in-lieu or foreclosure, executed early.
- Price the hedge honestly. Report the true cost of rate caps at a DSCR-neutral strike, and treat low strikes as unhedged risk.
- Know the sponsor. Track sponsor liquidity, fund life, guaranties and tax position. These determine who pays down, who fights and who hands back the keys.
- Invest in asset management. Active property-level management, from expense control to leasing to capex timing, is the one lever that improves outcomes in both liquidity and solvency cases.
Conclusion
The details of any individual portfolio will vary. Some books were underwritten conservatively and face a manageable liquidity squeeze. Others were written at peak prices and 75% leverage and are already insolvent in economic terms. Either way, a lender needs to know which kind of book it holds. Rates, expenses and values are all moving month to month right now, so decisions based on last year’s numbers are likely to be off. The lenders who keep their property data current will be in a much better position to make the right calls.
Appendix A: Methodology and Assumptions
- All model outputs are marked (E) and are illustrative, not forecasts.
- 2021 origination cap rates: multifamily 4.0%, industrial 4.0%, office 6.5%, retail 6.5%, self-storage 4.75%, manufactured housing 4.5%. 2016 cap rates: 5.0%, 5.5%, 6.0%, 6.3%, 5.7%, 5.8%.
- Original LTV: multifamily 75% (bridge, interest-only), manufactured housing 70%, others 65%. Portfolio stress applies a uniform 65% or 75%.
- Cumulative NOI change 2021-2026: multifamily +8%, office -15%, retail +8%, industrial +25%, self-storage +10%, manufactured housing +25%. 2016-2026: +30%, -20%, +10%, +55%, +35%, +55%.
- Current cap rates: CBRE H1 2026 survey Class A stabilized averages (multifamily 5.15%, industrial 5.62%, retail 6.31%, office CBD 8.24%); self-storage 5.75% and manufactured housing 5.25% are estimates.
- Refinance rates: agency multifamily ~6.39% at 1.25x; industrial, retail and storage 7.0%; manufactured housing 6.5%; office 7.9%; all at 1.35x DSCR, 30-year amortization. Maximum LTV caps: 75% multifamily, 70% manufactured housing, 65% others, 60% office.
- Capex reserves: industrial 1.0%, multifamily 1.25%, retail 1.75%, hotel 2.5%, office 2.75% of value.
- Loss given default assumes recovery of 88% of current value (12% liquidation cost and carry).
- Portfolio mix: 35% multifamily, 20% industrial, 15% retail, 15% office, 7.5% self-storage, 7.5% manufactured housing.
- Floating-rate analysis assumes a loan spread of SOFR + 3.00%.
Appendix B: Sources
- 12 CFR. Sections 217.10, 217.11 and 217.32; Section 3.144 (SSFA).
- Capright. Manufactured Housing Sector Update. September 2026.
- CBRE Econometric Advisors. U.S. Cap Rate Survey. H1 2026 and H2 2025.
- CBRE Investment Management. The Case For and Against Narrow Cap Rate Spreads.
- CBRE Research. U.S. Capital Markets Report; Office Report; Industrial Report. Q2 2026.
- Chatham Financial. Rate, forward curve and interest-rate cap pricing data (via Institutional Property Advisors). September 23, 2026.
- CME Group. FedWatch Tool (via Institutional Property Advisors). September 23, 2026.
- Cushman & Wakefield. U.S. Industrial MarketBeat. Q2 2026.
- Federal Reserve Bank of St. Louis (FRED). DGS10 Treasury yield series and ICE BofA corporate OAS and effective yield series. September 23, 2026.
- Federal Reserve System. Research on multifamily insurance costs. September 2025.
- Federal Financial Institutions Examination Council (FFIEC). Call Report Instructions (Nonaccrual Loans).
- First American. Has the CRE Maturity Wall Reached a Turning Point?
- Interagency Regulatory Agencies. Interagency Policy Statement on Prudent Commercial Real Estate Loan Accommodations and Workouts. 2023.
- Internal Revenue Service (IRS). Revenue Procedure 2009-45.
- Institutional Property Advisors (IPA) / Marcus & Millichap. Agency pricing grids and capital provider overviews. September 2026.
- Manufactured Housing Institute (MHI). Monthly Manufactured Home Shipments Report. March 2026.
- Mortgage Bankers Association. 2026 Loan Maturity Volumes.
- National Apartment Association. Operating expense and insurance cost data.
- National Association of Insurance Commissioners (NAIC). Life Risk-Based Capital Instructions; 2021 Real Estate Factor Revision; SSAP No. 37; Structured Securities Group Materials.
- Northmarq. Manufactured Housing Market Insights. Q1 2026.
- Trepp. CMBS Delinquency Rate Increased 51 Basis Points in July 2026. July 31, 2026.
- Trepp. July 2026 CMBS Delinquency Report. July 2026.
- Trepp. Where the Second-Half 2026 CMBS Refinance Gap Is Hiding. July 2026.
- Yardi Matrix and RentCafe. Multifamily and self-storage market reports. August 2026.
About the author and publishers
Mercury Capital Partners executive Andrew Shook brings decades of experience in CRE lending, capital markets and institutional finance at names such as Bank of America, HSBC Securities, A10 Capital and Lima One Capital.
Since 2010, CREModels has developed a nationwide network of borrower and lender contacts who rely on the company’s analytical expertise and AI-accelerated solutions for financial modeling, asset management, development, loan underwriting, managed services and more. CREModels executives founded Mercury Capital Partners as an independent commercial real estate debt advisory firm, with a focus on connecting CREModels clients to lenders whose balance sheets, underwriting standards and risk tolerances are the strongest fit for a particular asset, geography or capital need. Beyond senior debt placement, Mercury advises borrowers on loan restructurings, special servicing resolutions and other workout situations.
To discuss a specific loan or portfolio, submit a deal.